
Key Takeaways
- Java garbage collection reclaims heap objects that are unreachable from GC roots; losing one reference doesn't necessarily make an object collectible.
- Automatic GC doesn't prevent memory leaks, excessive allocation, or memory exhaustion outside the Java heap.
- Choose collectors around measured throughput and latency requirements, not a universal ranking: G1, Parallel, Serial, ZGC, and Shenandoah serve different goals.
- System.gc() is a request, not a scheduling guarantee. Diagnose problems with GC logs, jstat, jcmd, and Java Flight Recorder instead of routinely requesting collection.
Java garbage collection is the JVM's automatic process for reclaiming memory occupied by unreachable heap objects. It removes the need to explicitly free individual Java objects, but you still control how much your application allocates and how long it retains references.
If you've ever experienced an OutOfMemoryError, you know GC won't save you every time. Understanding reachability, collector tradeoffs, and monitoring helps you distinguish a memory leak from an undersized heap or a latency problem. The commands below target HotSpot-based JDK 25 unless another version is named; collector availability can differ by distribution and platform.
Understanding Java Garbage Collection
Why automatic memory management matters
With explicit memory management, application code must arrange for allocated memory to be released safely. Java delegates heap-object reclamation to the JVM, avoiding the need to decide when each shared object should be freed. That convenience doesn't make allocation free or retained data harmless.
The useful distinction is between unreachable and unwanted. GC can reclaim an unreachable object; it cannot know that an object still reachable through your cache is no longer useful to the business.
Heap, stacks, and other JVM memory
The Java heap holds class instances and arrays. Method calls create stack frames containing local variables and execution state; frames are pushed and popped in last-in, first-out order, not FIFO order. Returning from a method discards its frame, not necessarily the heap objects its references pointed to. See Java heap vs stack for that distinction.
JVM process memory — simplified HotSpot view
|
+-- Java heap: objects and arrays
+-- Thread stacks: method frames and local references
+-- Metaspace: class metadata
+-- Code cache: compiled machine code
+-- Other native memory: direct-buffer storage, VM structures, libraries
HotSpot stores class metadata in native Metaspace and compiled machine code in its code cache. Direct-buffer storage and other native allocations also consume process memory; -Xmx is not a limit on the whole process. Virtual-thread stacks add another implementation detail: their stack chunks are stored in the heap.
Compilation and object allocation are separate concerns. Our explanation of the Java JIT compiler covers how runtime compilation fits into execution.
Initial, maximum, reserved, and committed heap
For an executable application JAR, these illustrative settings configure an initial heap of 2 GiB and a maximum heap of 5 GiB—not a recommended size for every application:
# Requires your executable app.jar and sufficient available memory.
java -Xms2G -Xmx5G -jar app.jar
Reserved address space is a virtual-memory range set aside for potential use. Committed heap is memory made available for heap use; used heap is the portion currently occupied. HotSpot commonly reserves address space for its maximum heap without making every page physically resident at startup.
Collection first makes heap space reusable inside the JVM. Returning unused committed memory to the operating system is a separate, collector-dependent operation; a successful collection need not immediately reduce process memory usage.
How Garbage Collection Works in Java
Reachability, GC roots, and object graphs
A tracing collector starts from GC roots—references the VM treats as starting points—and follows references through the object graph. Typical sources include live thread stack or register references, class-related references, JNI handles used by native code, and other VM-managed references. The precise root set is implementation-specific; a constant-pool entry isn't automatically a universal category of root.
GC root --> live owner --> object A --> object B

            object C <--> object D
            No path from a root: collectible cycle
Objects can remain reachable indirectly through many other objects. Conversely, an isolated cycle is collectible even though its objects reference each other: what matters is whether a path from a root reaches them.
A complete reachability example
Save this as GcDemo.java. It demonstrates reference relationships, not the timing of a collection.
public class GcDemo {
    private static final MyClass MY_C = new MyClass("final");
    private static MyClass retained;

    private static final class MyClass {
        private final String name;

        private MyClass(String name) {
            this.name = name;
        }
    }

    private static void testMyClass() {
        MyClass c = new MyClass("hello");
        MyClass alias = c;
        c = null; // Removes one reference, not the object.
        retained = alias; // A static field now retains the object.
    }

    public static void main(String[] args) {
        testMyClass();
        System.out.println(retained.name);
        retained = null;
        System.out.println(MY_C.name);
    }
}javac GcDemo.java
java GcDemoNulling c doesn't make the "hello" instance unreachable because alias still refers to it. After the helper returns, retained keeps it reachable; clearing that field removes the remaining application reference in this example. MY_C keeps the other instance reachable while its class remains live. None of these assignments promises immediate collection.
Mark-sweep, copying, and mark-compact
These are conceptual building blocks, not a mandatory sequence implemented by every collector. Marking identifies reachable, live objects—not the garbage.
- Mark-sweep: trace live objects, then reclaim space belonging to unreachable objects. Leaving live objects in place can produce fragmented free space.
- Copying: move surviving objects into destination space, update references, and reuse the source space. This compacts the survivors but requires room for their destinations.
- Mark-compact: identify live objects and relocate them to consolidate free space. It also moves object contents; “moving instead of copying” isn't the essential distinction.
The engineering tradeoff is how much tracing, relocation, bookkeeping, and spare capacity a collector needs—and how much work it performs while application threads are stopped.
Generations, Survivor Spaces, and G1 Regions
The traditional young-generation model
Generational collection exploits a common workload pattern: many objects die young. A traditional generational heap separates young objects from longer-lived objects so that frequent young collections can avoid repeatedly tracing the entire heap. This is a useful model, not a universal physical layout.
Eden and the survivor spaces
In the traditional copying model, most new objects start in Eden. During a young collection, surviving objects are copied from Eden and the occupied survivor space into the other survivor space, or promoted to old space. The two survivor spaces, conventionally S0 and S1, exchange source and destination roles.
Why survivor spaces exist
Survivor space gives objects more time to become unreachable before they occupy old-generation space. Having a separate destination also lets collection consolidate surviving objects rather than leave holes between them.
Promotion and the old generation
Longer-lived objects can be promoted into the old generation. Promotion depends on age, survivor capacity, and collector policy; there is no universal “16 collections” rule. Nor does every collector handle large objects or old-generation reclamation the same way.
How Java G1 GC uses regions
G1 is generational, but its heap consists of equally sized regions rather than one fixed contiguous area per generation. Regions can serve as Eden, survivor, old, or free regions, and live objects are evacuated into destination regions. G1 prefers reclamation work that offers a good return for its estimated cost.
G1 uses remembered sets and card-based bookkeeping to track references into collected regions from elsewhere in the heap. That lets it collect selected regions without rescanning every heap object for incoming references. This bookkeeping also costs memory and processing time.
Humongous objects are at least half a G1 region in size and receive special treatment, including allocation into old-generation regions. Repeated large-array allocations can therefore create different pressure from ordinary small-object allocation; investigate them before changing region-size settings.
When collection happens: young, mixed, and full GC
Collectors schedule work using allocation pressure, occupancy, predictions, and collector-specific heuristics—not a universal rule that collection starts only when Eden or old space is completely full. G1 can begin concurrent marking based on predicted old-generation pressure.
For G1, distinguish these events:
- Young collection: evacuates young-generation regions, keeping or promoting survivors.
- Concurrent marking: determines liveness largely while application threads run, with stop-the-world coordination phases.
- Mixed collection: collects young regions plus selected old regions after marking.
- Full GC: performs stop-the-world whole-heap compaction, including as a fallback when normal reclamation cannot keep up.
“Minor,” “major,” and “full” aren't interchangeable labels across collectors. Use the event names in your selected collector's logs. G1's pause-time target is a goal, not a hard real-time guarantee.
Choosing Java Garbage Collectors
Throughput, latency, and concurrent work
Throughput describes useful work completed over time. Latency describes how long an operation takes, including delays caused by pauses. A batch job and an interactive service can reasonably prefer different collectors.
A stop-the-world phase pauses application threads; it doesn't imply that only one GC worker runs. Concurrent work overlaps application execution, but consumes CPU and needs enough memory headroom to make progress. Low-pause collectors still have brief stop-the-world phases.
| Collector | Useful starting point | Main tradeoff | Selection option |
|---|---|---|---|
| Serial | Small heaps or constrained CPU resources | Single-threaded, stop-the-world collection | -XX:+UseSerialGC |
| Parallel | Throughput-focused batch work | Parallel young and old collection, with stop-the-world pauses | -XX:+UseParallelGC |
| G1 | General-purpose services | Balances throughput and pause goals; evacuation still pauses application threads | -XX:+UseG1GC |
| ZGC | Services with demanding latency requirements | Moves substantial work concurrently, trading CPU and capacity for short pauses | -XX:+UseZGC |
| Shenandoah | Low-pause workloads on a supporting JDK build | Concurrent marking and compaction; measure throughput and CPU costs | -XX:+UseShenandoahGC |
These are starting points, not performance rankings. The HotSpot options above depend on platform and build support; Shenandoah in particular isn't included in every distribution. Start with your runtime's default and benchmark alternatives under representative load.
Defaults and modern low-pause collectors
G1 became the HotSpot server-configuration default in JDK 9 and remains the usual default on server-class configurations in JDK 25. That isn't a guarantee for every JVM implementation or resource configuration.
ZGC was experimental in JDK 11 and became production-ready in JDK 15. Generational ZGC arrived in JDK 21, became the default ZGC mode in JDK 23, and replaced the non-generational mode in JDK 24. On JDK 25, select it with -XX:+UseZGC; don't copy older experimental-unlock or generational-selection flags into new configurations.
Shenandoah is a distinct concurrent collector, not an improved version of G1. Supported builds can select it without an experimental unlock; its generational mode became a product feature in JDK 25 and can be selected with -XX:ShenandoahGCMode=generational alongside -XX:+UseShenandoahGC. Check your distribution's documentation before choosing a mode.
Removed and specialized collectors
CMS was removed in JDK 14. It is historical context, not a current collector choice. Likewise, don't treat “Parallel Old” as a separate modern selection: use Parallel GC, which parallelizes collection of both generations.
Epsilon doesn't reclaim objects. In HotSpot JDK 25 it remains experimental and uses -XX:+UnlockExperimentalVMOptions -XX:+UseEpsilonGC. Reserve it for tightly bounded experiments or jobs whose allocation fits their heap; continued allocation eventually exhausts available heap space. It isn't a general-purpose shortcut to low latency.
Can You Force Garbage Collection in Java?
These are two equivalent ways to request collection, not commands that guarantee reclamation of a particular object:
// Fragment: alternative ways to request GC, not routine application control.
System.gc();
Runtime.getRuntime().gc();
On HotSpot, -XX:+DisableExplicitGC disables processing of explicit System.gc() requests without disabling automatic GC. Otherwise, handling depends on the collector and configuration: a request can cause a costly full collection or initiate concurrent work. Don't use it to schedule cleanup or compensate for retained objects.
Reference types and resource cleanup
Soft, weak, and phantom references have specialized reachability semantics. Soft references may be cleared under memory demand; weak references don't keep otherwise weakly reachable objects alive; phantom references support post-mortem notification through reference queues. They aren't substitutes for explicit cache bounds or lifecycle management.
Java Garbage Collection Monitoring
Enable unified GC logging
HotSpot's unified logging is available on JDK 9 and later. For your executable application JAR, this JDK 25 example writes GC details to a rotating file set:
# Requires your executable app.jar in the current directory.
java '-Xlog:gc*:file=gc.log:time,uptime,level,tags:filecount=5,filesize=10M' -jar app.jar
Start with event type, cause, pause duration, and heap occupancy before and after collection. A summary shaped like BEFORE->AFTER(CAPACITY) reports occupancy and heap capacity, not necessarily the configured maximum. Concurrent-cycle elapsed time isn't the same as time the application was paused.
Use jstat for periodic summaries
# Replace 46562 with your JVM's process ID.
jstat -gc 46562 1000 5
This requests five samples at 1,000-millisecond intervals—not a real-time event trace. Useful documented fields include:
S0C/S1C,EC,OC: survivor, Eden, and old-space capacities in KB.S0U/S1U,EU,OU: corresponding usage in KB.MC/MU,CCSC/CCSU: Metaspace and compressed-class-space committed/used sizes.YGC/FGC: young/full collection counts;YGCT/FGCT/GCT: collection-time totals.
Interpret output against the collector and JDK. The documentation labels jstat experimental and unsupported and warns against depending on its output format in scripts.
Inspect the JVM with jcmd and JFR
Use matching-version JDK tools with access to the target process. Local jcmd attachment requires the same effective user and group as the target JVM; containers and disabled attachment can impose additional restrictions.
# List accessible JVMs; jps is another process-discovery option.
jcmd -l

# Replace 46562 with the target PID.
jcmd 46562 GC.heap_info
jcmd 46562 JFR.start name=gc settings=profile duration=60s filename=gc.jfr
GC.heap_info reports heap information. The recording command collects a 60-second Java Flight Recorder profile; inspect it in JDK Mission Control to correlate GC, allocation, CPU, and application activity. The profile configuration collects more data with more overhead than the default configuration, so use it for bounded investigations.
Keep JConsole for quick visual inspection
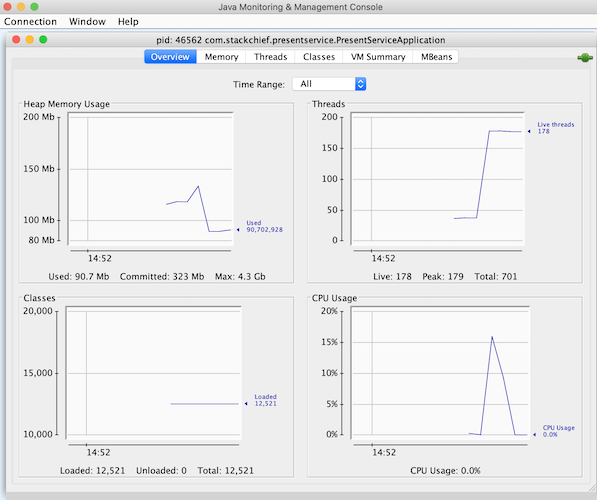
jconsoleJConsole provides a graphical view of memory, threads, classes, and CPU activity. Connect to an accessible local process for a quick overview; the retained screenshots below show an older interface, not a promised current appearance.
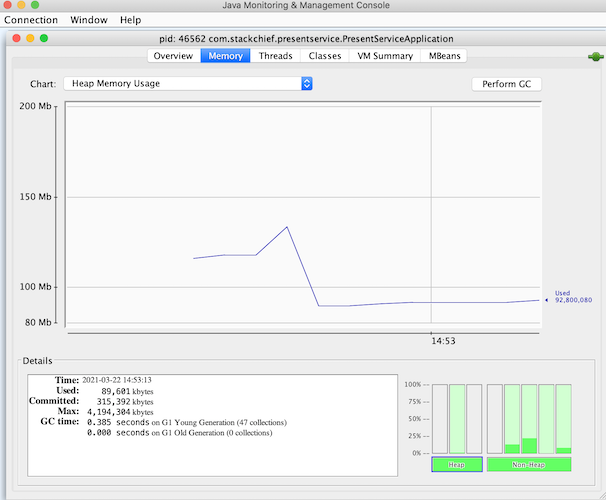
The Memory tab also offers a Perform GC button. Treat it as a diagnostic request with possible performance consequences, not a production maintenance strategy.
Interpret metrics before tuning flags
- Correlate pauses with user impact. Compare pause distributions and total paused time with application latency, rather than collection counts alone.
- Find allocation sources. Use recordings to identify allocation-heavy paths; then check whether reducing those allocations improves the workload.
- Watch promotion and post-GC occupancy. A rising baseline across comparable completed old-generation reclamation cycles warrants investigating retention, but isn't proof of a leak.
- Separate heap and process pressure. If heap usage is stable while process memory rises, investigate native memory and other JVM areas.
This workflow combines GC logs, recording data, and memory-pool trends rather than treating one counter as a diagnosis.
Common Mistakes and Production Checks
- Retaining unwanted objects: inspect unbounded static collections, caches, listeners, and thread-local values. A reachable object graph stays alive even when you no longer want it. Review ownership alongside your Java collections usage.
- Setting the heap equal to the container limit: leave room for stacks, Metaspace, direct buffers, GC bookkeeping, and other native allocations. HotSpot's Linux container detection informs resource ergonomics, but heap capacity still isn't the process's total memory budget.
- Assuming every OOM means a full heap: read the actual error detail and process termination evidence before changing heap settings. Metaspace exhaustion and native-memory pressure require different investigations.
- Changing many flags together: establish a representative baseline, change one variable, and compare throughput, tail latency, CPU, and memory under the same resource limits.
Garbage Collection Interview Questions in Java
Can objects referencing each other still be collected?
Yes. An isolated cycle is collectible when no GC root reaches it; tracing collection doesn't require each object to have a reference count of zero.
Why not promote every survivor directly into old space?
Survivor space gives short-to-medium-lived objects another opportunity to become unreachable before promotion. The actual policy depends on the collector and available space.
Why isn't the lowest-pause collector always the best choice?
Pause reduction can trade away throughput or require additional concurrent CPU work and memory headroom. Explain the application's goals before recommending a collector.
FAQ
How does garbage collection work in Java?
Tracing collectors follow references from GC roots to identify reachable objects and reclaim space occupied by unreachable objects. Collectors differ in heap layout, relocation strategy, and how much work happens concurrently with the application.
Does System.gc() force garbage collection?
No. System.gc() requests collection but guarantees neither reclamation of a particular object nor completion at a particular time. HotSpot can disable explicit requests with -XX:+DisableExplicitGC.
Which garbage collector is the default in modern Java?
G1 is the usual HotSpot default on server-class configurations and became the server-configuration default in JDK 9. Other JVM implementations and constrained configurations can choose differently, so confirm your runtime's selected collector.
Can Java have memory leaks with garbage collection?
Yes. An application can retain unwanted objects through reachable collections, caches, or other references, preventing reclamation. Garbage collection cannot distinguish intentional retention from a logical memory leak.
How do I enable and read Java GC logs?
On HotSpot JDK 9 and later, launch your application with -Xlog:gc* before the application arguments. Inspect pause durations, causes, and occupancy trends; distinguish concurrent-cycle duration from stop-the-world pause time.
Further Reading
- HotSpot available collectors — selection goals and supported options.
- G1 collector documentation — regions, collection phases, and remembered sets.
- ZGC configuration guide — generational operation and heap-sizing considerations.
- Java launcher reference — heap settings, explicit-GC controls, and unified logging.
- jstat command reference — sampling syntax, fields, and limitations.
- jcmd command reference — heap inspection and flight-recording commands.
- Java reference-object semantics — strong, soft, weak, and phantom reachability.
- Troubleshooting memory leaks — memory exhaustion and retained-object diagnosis.
